Comparing the NBA and WNBA
Do you like offensive rebounding? How about the midrange game? Well, I’m here to tell you that you might enjoy watching the WNBA and help find your potential new favorite team based on your NBA preferences!
In addition to matching NBA teams with comparable teams in the WNBA, I compare the leagues in a number of statistics throughout the last 10 seasons. To address these questions I created a Shiny app hosted here. In the app you can compare any team from 2010-2020 in both the NBA and WNBA for a number of different statistical categories as well as see the change over time in each league.
I present some of the interesting observations I found from using the app in this post, but encourage you to play with it on your own!
Statistical differences between the leagues
First, I wanted to figure out how the WNBA differs from the NBA across the last 10 seasons. The two leagues have largely followed similar trajectories (i.e. more threes and less offensive rebounds) but there are many differences between them, some surprising and others more obvious.
After watching a couple WNBA games one of the most apparent distinctions is the shot distribution. Most WNBA teams seem to take far more midrange shots than is customary in the present day NBA, and that is exactly what we see in the data. Given that WNBA games are shorter than the NBA, we compare the shot distributions between the two leagues by looking at the number of shot attempts from a given location per possession. This allows us to look at differences without needing to adjust for time or pace.
Using data from stats.nba.com and stats.wnba.com, we see in the figure below that every WNBA team in the 2020 season took more midrange shots (5 - 19 feet) than the average NBA team in the 2019-20 season. The New York Liberty took by far the least in the mid range while the Las Vegas Aces, with A’ja Wilson and their interior dominance, took over 0.4 shots per possession from these distances. In the NBA, San Antonio is the only team that took more than 0.3 shots per possession of their shots from 5 - 19 feet, and the Houston Rockets took only 0.15.
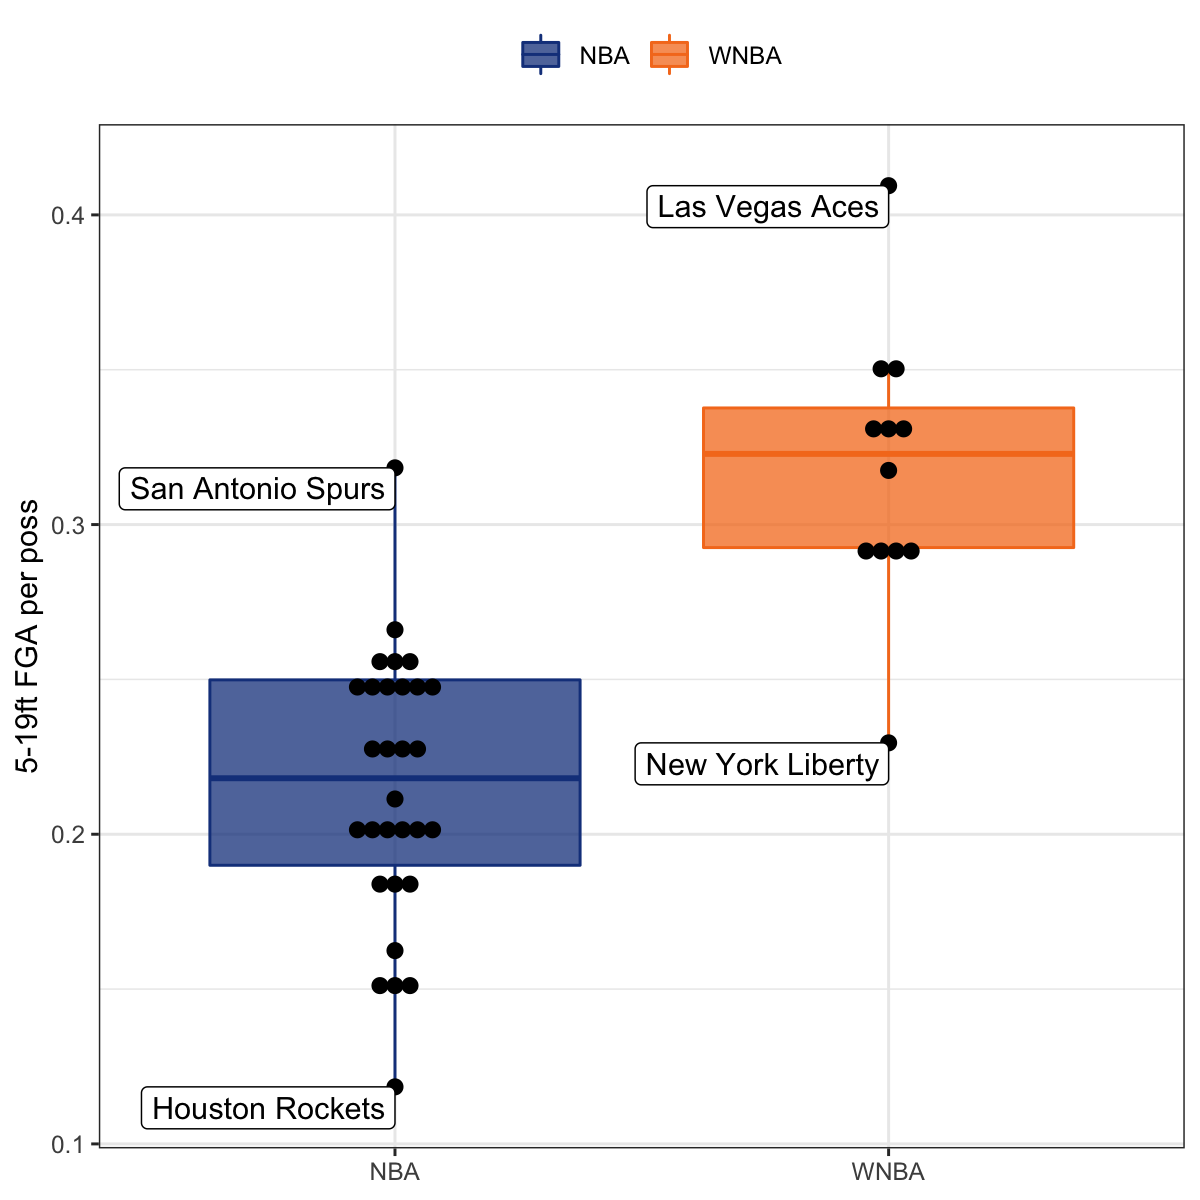 Note, an interactive version of this plot that allows the user to see where all teams fall on the distribution is in the Shinny app. For purposes of formatting, I made a static version for this post.
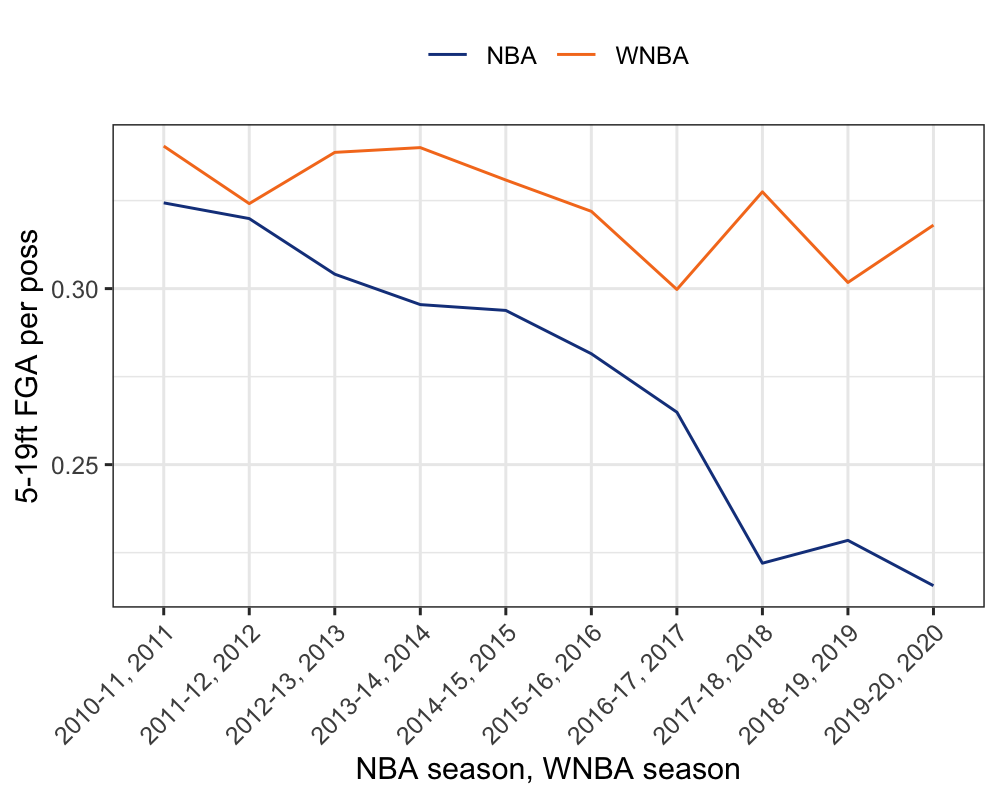
In addition to looking at how the distributions differ between teams this season, I looked at the change over the last 10 seasons. Here we see that the reduction in midrange shots has occurred much more dramatically in the NBA than the WNBA.
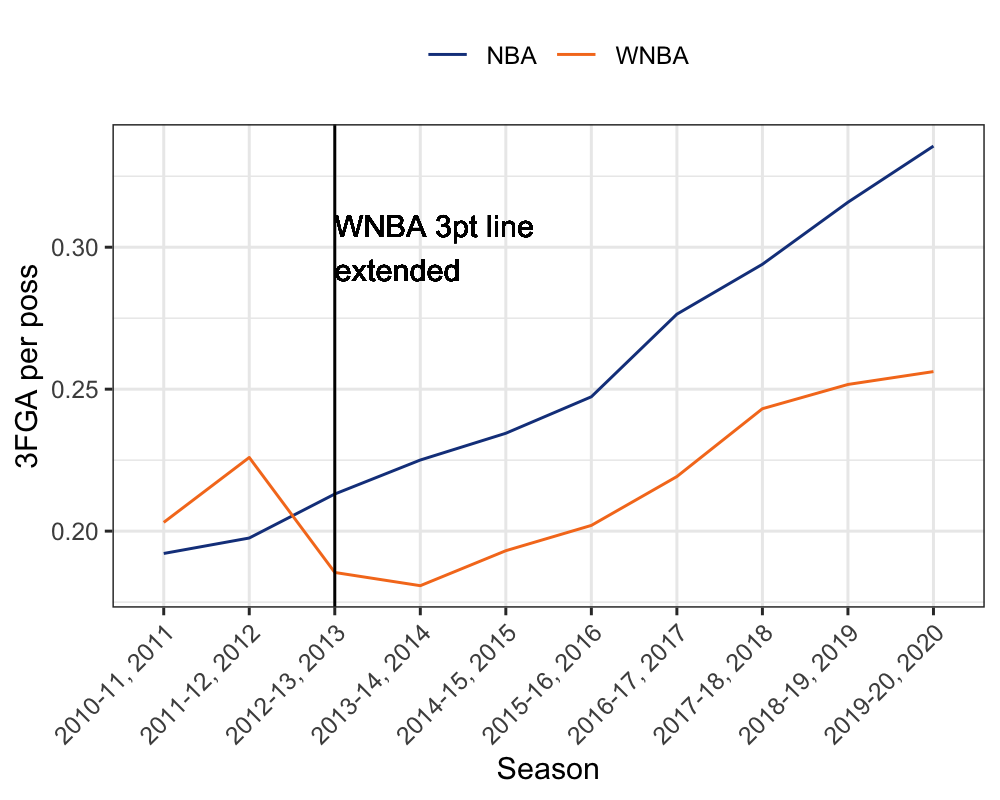
This increase in midrange shot taking is coupled with fewer shot attempts, in the WNBA, from three point range. Below, we see the trend in 3 point attempts per possession over time. To see the distribution for the 2020 WNBA and 2019-20 NBA seasons check Shiny app. Prior to moving the three point line back for the 2013 season, WNBA teams were taking more 3 FGA per possession than NBA teams on average, but over the last decade the increase in three point attempts in the NBA has been much more dramatic.
There are a number of other statistics which differ between the leagues including, FG% (higher in the NBA), FT% (higher in the WNBA), offensive rebound % (higher in the WNBA), and pace (higher in the NBA). I encourage you to explore the season by season distributions and overall trends of those statistics.
Which WNBA team should I root for?
The app can help you find the best fit in the WNBA based on your favorite NBA team, and the statistical categories you care about. We saw in the previous section that the leagues are quite different, so the comparison is not perfect, but it’s still fun! Below are a few examples.
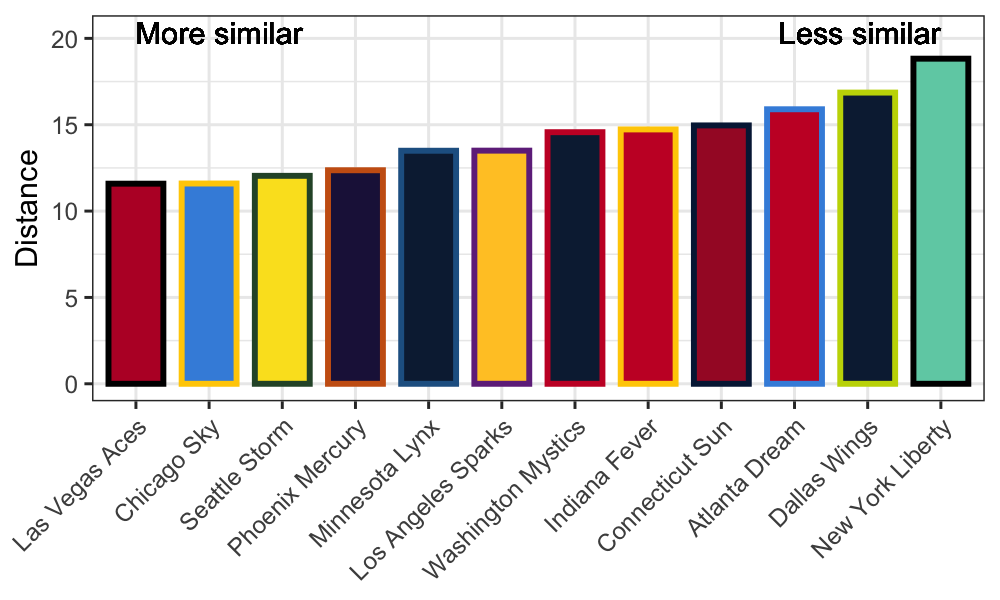
The Milwaukee Bucks
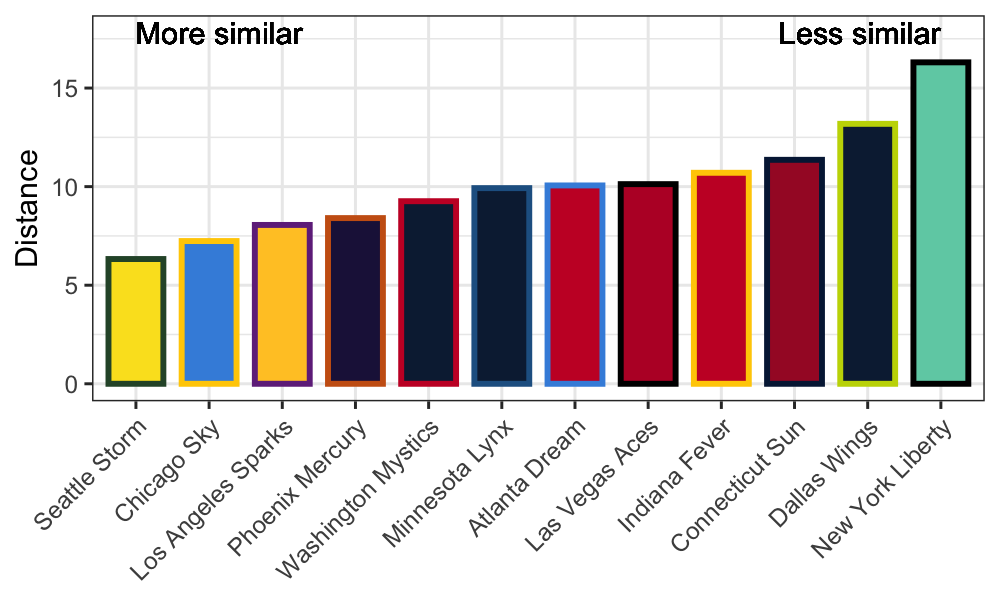
Let’s say I want to see which WNBA teams play most like the Bucks across all the statistical categories included in this analysis. Then we find that the Aces are most similar, followed by the Chicago Sky (who just had two key players leave the bubble, Diamond DeShields and Azurá Stevens) and the Seattle Storm. In general, the better WNBA teams are more similar to the Bucks and the worse teams are less similar.
The Houston Rockets
If your favorite thing to do is watch an offense predicated around the three pointer, you could see which WNBA teams are most like the Rockets in terms of their shot distribution (by selecting FGA from various distances). In that case you may want to tune into the New York Liberty or the Connecticut Sun, but definitely not the Aces.
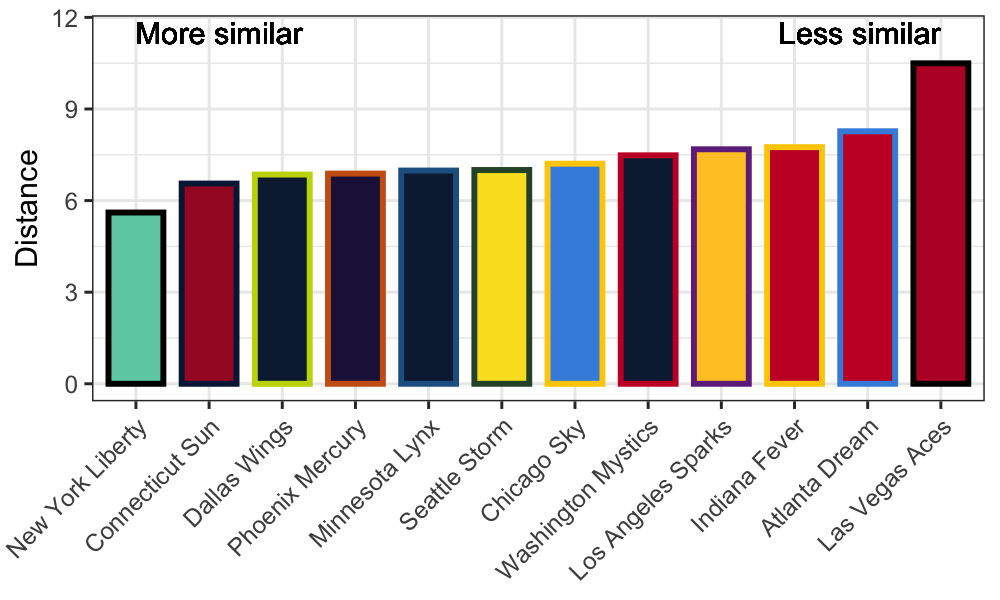
However, be warned about the Liberty, because although they take a lot of threes, they don’t shoot a high percentage. In fact, if we include FG% statistics in addition to the FGA stats, we see that the Liberty are one of the least similar teams to the Rockets… try that for yourself if you want to see the change.
The 2014-15 Warriors
As a final example, let’s say that you just loved watching the Warriors offense on the way to the first title in their recent run, because I mean who didn’t? In that case try to catch the Storm, Sky, or Sparks.